ElastiFlow: Monitoring network traffic with Netflow and ELK Stack and OpenWRT (Deprecated)
Overview
Setup NetFlow on OpenWRT
NetFlow is a network protocol system created by Cisco that collects active IP network traffic as it flows in or out of an interface. In my case all traffic runs from router with OpenWRT. To activate netflow monitoring we need to install softflowd package.
softflowd - is a software implementation of a flow-based network traffic monitor. softflowd reads network traffic and gathers information about active traffic flows.
1opkg update
2opkg install softflowd
3/etc/init.d/softflowd start # or stop, or restart
Config file: /etc/config/softflowd
 1root@OpenWrt:~# cat /etc/config/softflowd
 2config softflowd
 3        option enabled        '1'
 4        option interface      'br-lan'
 5        option pcap_file      ''
 6        option timeout        'maxlife=60'
 7        option max_flows      '8192'
 8        option host_port      '192.168.10.55:2055'
 9        option pid_file       '/var/run/softflowd.pid'
10        option control_socket '/var/run/softflowd.ctl'
11        option export_version '5'
12        option hoplimit       ''
13        option tracking_level 'full'
14        option track_ipv6     '0'
15        option sampling_rate  '10'
Useful commands:
softflowctl statistics
softflowctl dump-flows
 1root@OpenWrt:~# softflowctl statistics
 2softflowd[4563]: Accumulated statistics since 2021-02-07T19:39:59 UTC:
 3Number of active flows: 27
 4Packets processed: 16176338
 5Fragments: 2352200
 6Ignored packets: 55416 (55410 non-IP, 6 too short)
 7Flows expired: 59561 (0 forced)
 8Flows exported: 114321 in 6271 packets (0 failures)
 9Packets received by libpcap: 16231910
10Packets dropped by libpcap: 0
11Packets dropped by interface: 0
12
13Expired flow statistics:  minimum       average       maximum
14  Flow bytes:                  40        233515     740181706
15  Flow packets:                 1           272        728069
16  Duration:                  0.00s        17.90s       111.24s
17
18Expired flow reasons:
19       tcp =     13888   tcp.rst =      6337   tcp.fin =     12323
20       udp =     18408      icmp =       577   general =        20
21   maxlife =      8008
22over 2 GiB =         0
23  maxflows =         0
24   flushed =         0
25
26Per-protocol statistics:     Octets      Packets   Avg Life    Max Life
27           icmp (1):         712567         2244      17.02s      64.16s
28           igmp (2):           3656           89      10.80s      60.74s
29            tcp (6):     9019595755      9503208      23.06s     111.24s
30           udp (17):     4888056323      6670438       8.06s      90.58s
1root@OpenWrt:~# softflowctl dump-flows
2softflowd[4563]: Dumping flow data:
3ACTIVE seq:59825 [192.168.10.4]:46672 <> [192.168.10.22]:443 proto:6 octets>:2929 packets>:16 octets<:6911 packets<:16 start:2021-02-09T02:54:37.540 finish:2021-02-09T02:54:42.650 tcp>:1b tcp<:1b flowlabel>:00000000 flowlabel<:00000000
4EXPIRY EVENT for flow 59825 now
5
6ACTIVE seq:59826 [142.250.69.206]:443 <> [192.168.10.4]:54510 proto:6 octets>:195 packets>:3 octets<:414 packets<:6 start:2021-02-09T02:54:38.569 finish:2021-02-09T02:55:32.298 tcp>:19 tcp<:19 flowlabel>:00000000 flowlabel<:00000000
7EXPIRY EVENT for flow 59826 now
8...
ELK Configuration
The ELK stack is an acronym used to describe a stack that comprises of three popular open-source projects: Elasticsearch, Logstash, and Kibana. Often referred to as Elasticsearch, the ELK stack gives you the ability to aggregate logs from all your systems and applications, analyze these logs, and create visualizations for application and infrastructure monitoring, faster troubleshooting, security analytics, and more.
Instalation: Here my installation example(on ubuntu 20.04 server), but I recommend to check official documentation because it changes pretty quickly.
1sudo apt install apt-transport-https
2wget -qO - https://artifacts.elastic.co/GPG-KEY-elasticsearch | sudo apt-key add -
3echo "deb https://artifacts.elastic.co/packages/7.x/apt stable main" | sudo tee -a /etc/apt/sources.list.d/elastic-7.x.list
4sudo apt update
5sudo apt install elasticsearch logstash kibana
6sudo systemctl enable elasticsearch.service logstash.service kibana.service
7sudo systemctl start elasticsearch.service kibana.service
Cause this installation for educational purposes, all configuration files are left by default.
ElastiFlow Instalation
ElastiFlow™ - provides network flow data collection and visualization using the Elastic Stack. It supports Netflow v5/v9, sFlow and IPFIX flow types. In simple words is a set of configuration files for logstash and preconfigured kibana dashboard.
Full config settings and tuning ElastiFlow is out of scope this article, here an example to make it work. Please read official Installation guide for better understanding.
 1#install the sFlow codec for Logstash
 2sudo /usr/share/logstash/bin/logstash-plugin install logstash-codec-sflow
 3sudo /usr/share/logstash/bin/logstash-plugin list --installed
 4sudo /usr/share/logstash/bin/logstash-plugin update logstash-codec-netflow
 5
 6
 7# download ElastiFlow files and copy them in system
 8wget https://github.com/robcowart/elastiflow/archive/v4.0.1.tar.gz
 9tar xf v4.0.1.tar.gz
10sudo chown root:root -R elastiflow-4.0.1/
11sudo rsync -avh elastiflow-4.0.1/logstash.service.d /etc/systemd/system/
12sudo rsync -avh elastiflow-4.0.1/logstash/elastiflow /etc/logstash/
13
14# increasing the priority of the Logstash service
15sudo sed -i 's/Nice=19/Nice=0/g' /etc/systemd/system/logstash.service
16# specify Logstash configuration path
17sudo sed -i 's/main/elastiflow/g' /etc/logstash/pipelines.yml
18sudo sed -i 's:logstash:logstash/elastiflow:g' /etc/logstash/pipelines.yml
19
20#Logstash startup script to take the variables from configs
21sudo /usr/share/logstash/bin/system-install
22# apply changes for logstash servece
23sudo systemctl daemon-reload
24# start
25sudo systemctl start logstash.service
26# starting process can be viewed in
27/var/log/logstash/logstash-plain.log
28
29#In kibana go to "Management/Stack Management/Saved Objects" and import
30elastiflow-4.0.1/kibana/elastiflow.kibana.x.x.x.ndjson
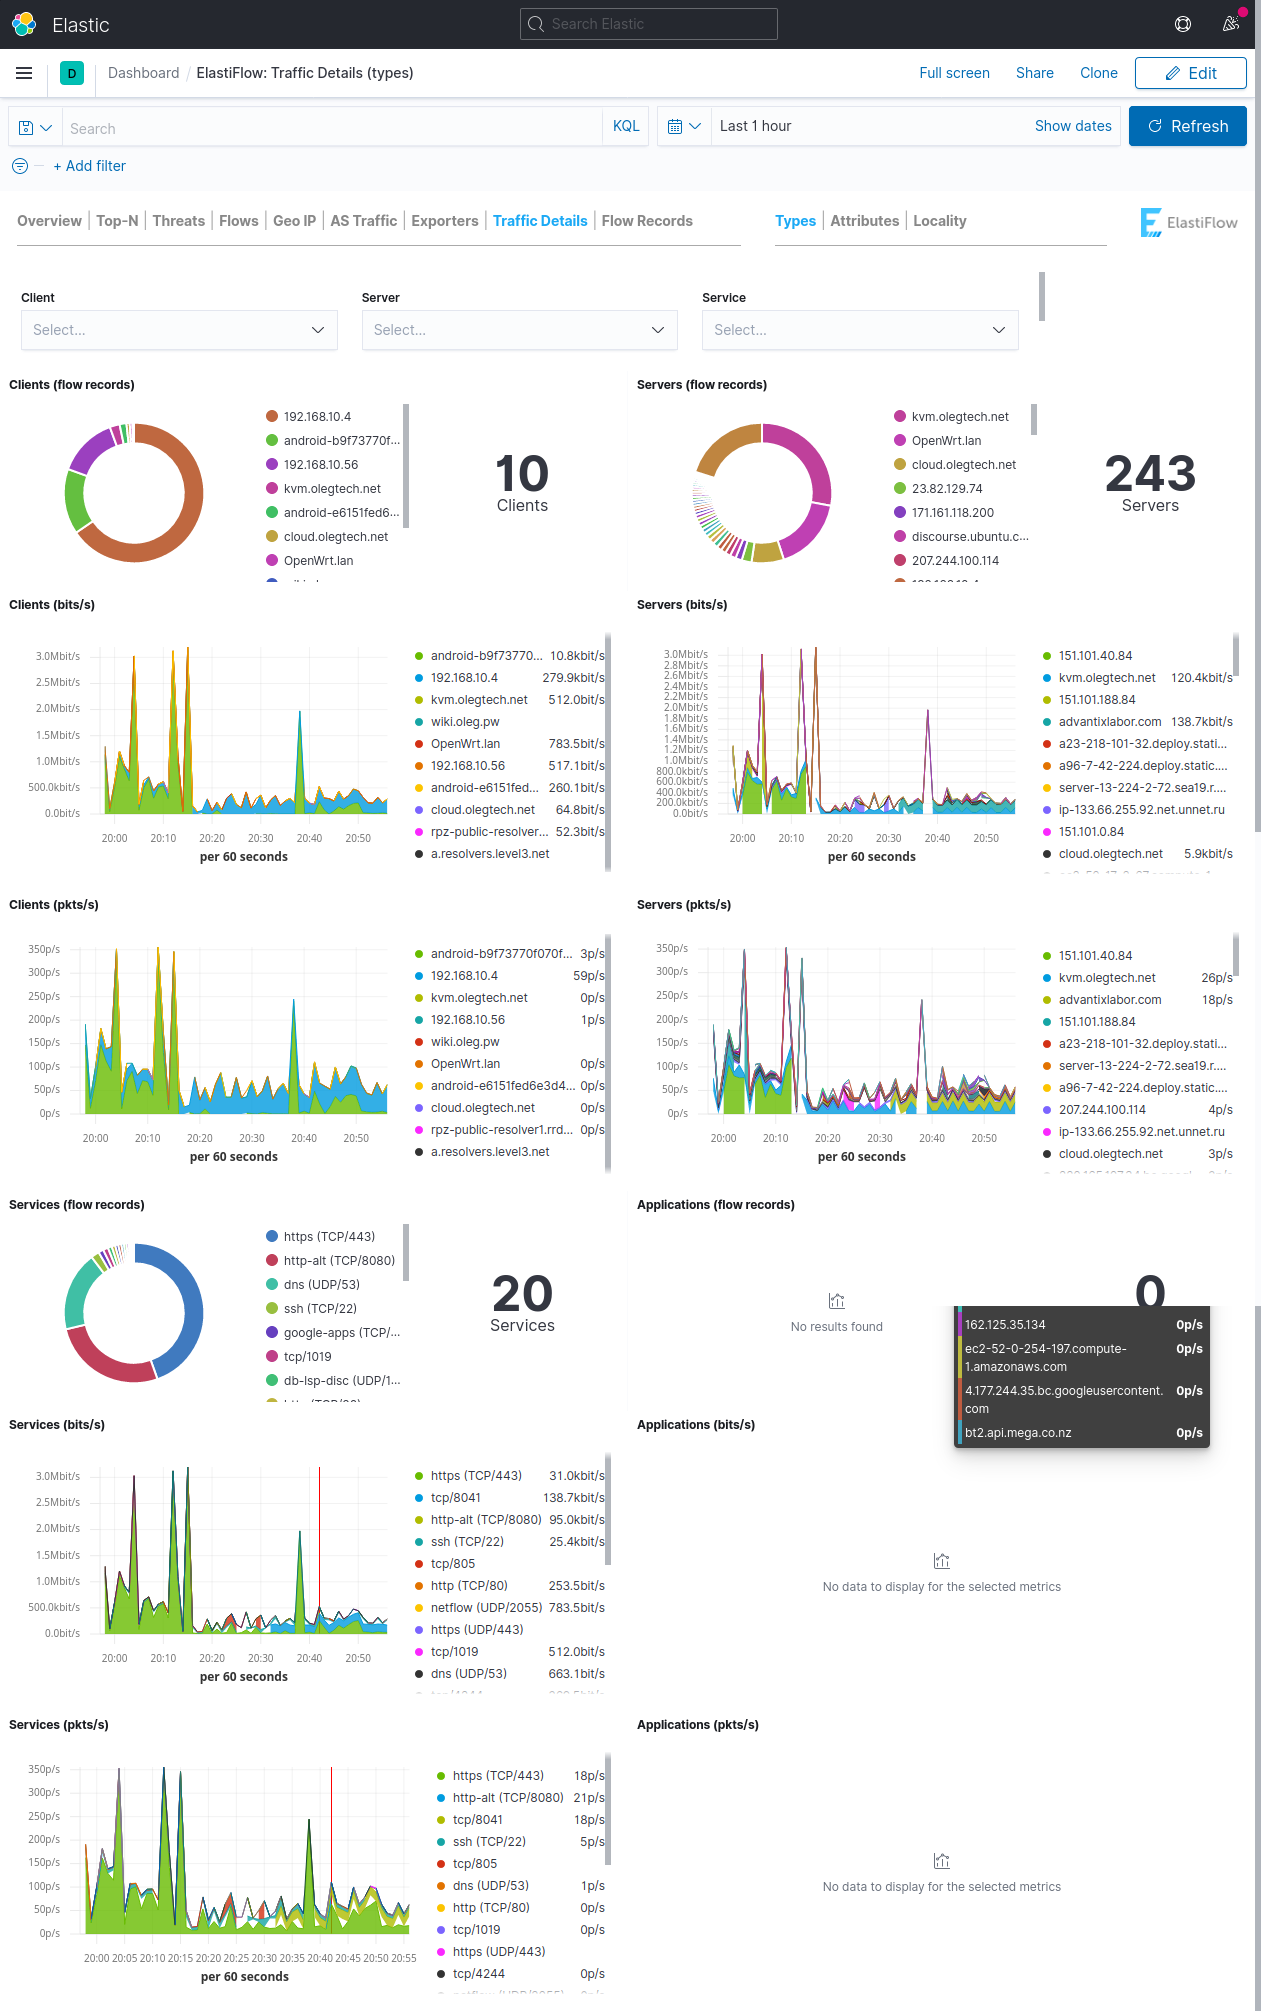
ElastiFlow screenshots
